To structure deals that multiply customer value in exchange for a commitment, you must estimate the value numerically by constructing a model. There is no one-size-fits-all approach to building a model, and the model will vary depending on the type of product you are selling. The ultimate goal is to present credible estimates to your customers, using data inputs they provide that clearly show the value they are obtaining numerically. The more convincingly you can compute the value creation in your customer’s eyes, the higher the probability of closing a long-term commitment.
Economic value is a loaded topic because it is subject to estimation and interpretation. In many cases, it is impossible to know the true economic value of a product, and one must rely on credible estimates. The mechanics of building models are less important than the thought process of trying to estimate value, and failure to try to quantify value creation in the eyes of customers is, in my opinion, the number one reason why companies fail to gain sales traction at scale.
Let’s dive in with the company example from the previous article. Our hypothetical company makes a SaaS product that allows companies to outsource HR compliance functions to reduce cost. The product enables companies to minimize headcount, maintain up-to-date policies in a rapidly changing world, and avoid fines and lawsuits from non-compliance. The product costs $3,000 per month per company division, and in this case, our customer has seven divisions, for a total cost of $21,000 per month, or $252K annually. The customer is currently on a month-to-month agreement, and our goal is to obtain an annual commitment.
In the previous example, the customers 2021 goals and objectives are as follows:
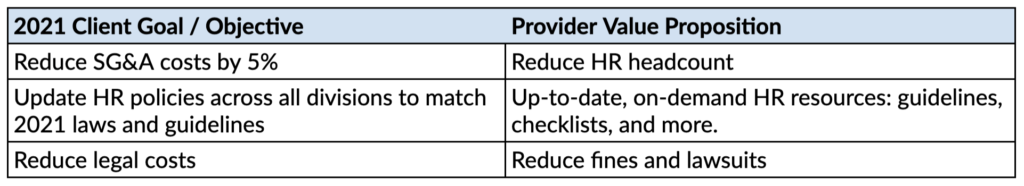
Here are some additional data points on each goal that you gathered from your discover questions:
- Reduce SG&A costs by 5%: the current companies SG&A expense is $15M annually, and a 5% reduction is $750K annually.
- Update HR policies across divisions to match 2021 laws and guidelines: the customer was fined $250K last year by the California Labor Board for misclassifying a few employees as contractors, in addition to a few other HR errors.
- Reduce legal costs: the client spent $2M in legal fees fighting lawsuits related to employee misclassification, compliance issues, and in one case, a hiring manager asked illegal interview questions (and was unaware that the questions were unlawful).
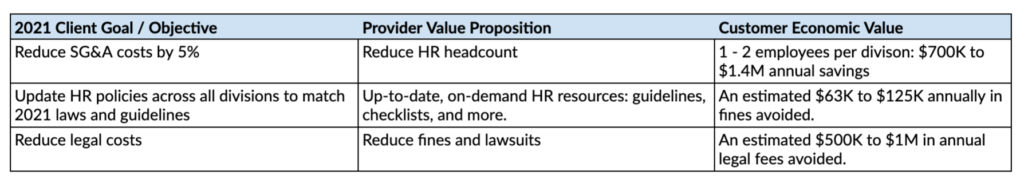
Next, let’s revisit the previous table where we added a third volume to estimate customer economic value:
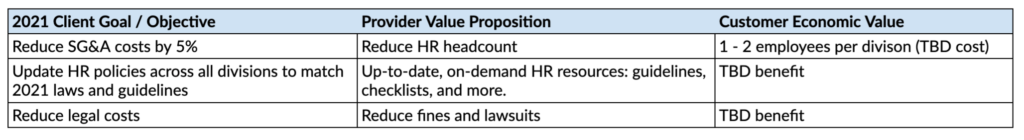
The above table tells us precisely what types of value we are trying to compute. Let’s start with the first item, the economic value of saving one to two HR employees per division. From your research, you know that the average HR compliance employee costs roughly $100,000 annually. This $100K estimate is an “all-in” estimate and includes the employee wages, benefits, etc. Let’s estimate the annual savings:
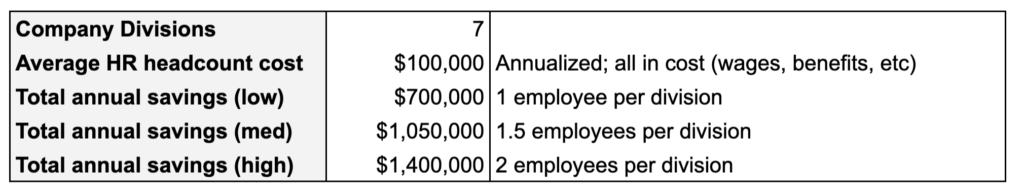
In this case, we computed the company’s total savings per year, estimating low, medium, and high cases. At an annual cost of $252K for our product, the company generates a minimum $700K in total value or ~2.8x ROI (Return-On-Investment). Best case, the company generates a 5.5x ROI.
That one was easy; let’s try something more challenging. The second value proposition is the benefit of providing up-to-date, on-demand HR resources for the companies seven divisions. While it’s difficult to estimate the impact of avoiding lawsuits and HR fines, we can use the companies track record from the previous year: $2M in HR-related legal fees and $250K in total penalties. Now let’s perform some estimates based on different percentages of hypothetical future fees avoided:
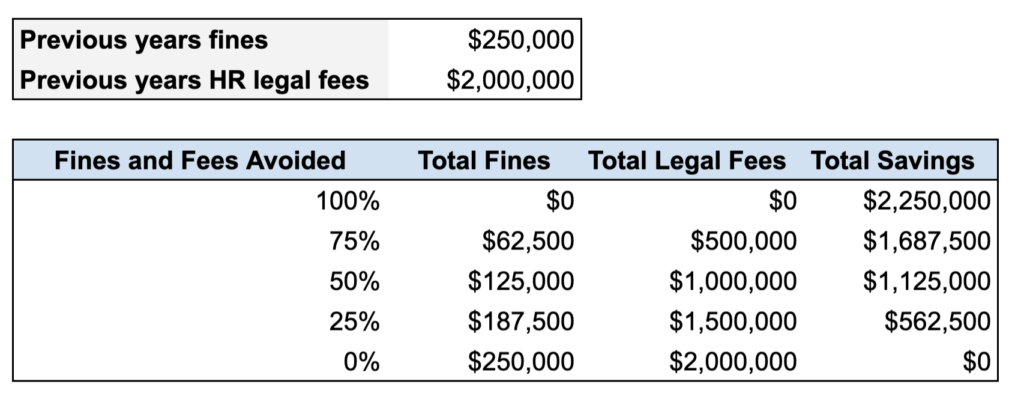
In this case, we also have data showing that, on average, companies reduce their fines and HR-related legal fees by anywhere from 25% to 50% by subscribing to our software. Now we have the second and third part of our value estimate, an estimated combined savings of $562K to $1.1M annually.
Now, let’s complete our table:
With the above data, we can estimate our products’ total economic value for this one client. Our low estimate is $700K (headcount reduction) + $63K in reduced fines + $500K in estimated reduced legal fees = $1.26M annual savings, for a cost of $252K annually, or a 5x ROI. Using the high estimate, the total economic value is $2.53M, or a 10x ROI. We have also clearly aligned the economic value to the customer’s 2021 goals and objectives.
You may be thinking that this model is relatively simple, and it is. Your model may be much more complicated and include a lot more variables. The key is to share the model’s output with your customer and provide a clear justification for calculating their total value. In some cases, you may want to share the actual model with your customers so that they can review it offline. The model doesn’t need to be perfect; what matters is that the model quantifies the value creation of the product and provides credible estimates that will hold up to scrutiny.
Now we’re ready for part four in my series: creating tiered value multiplying deals that align with your customer’s goals and objectives.