
Accurately scoring a sales team is a critical responsibility of a sales manager. In this article, I’ll show you how to set up a simple model to score your sales team using a normal distribution. The model is easy to build in Excel or Google Sheets, and to make it extra easy for you, I have included a downloadable copy below:
It is important to note that this model is not as useful in an early-stage company with a handful of salespeople and limited sales data. The model works better once you have a team of at least four salespeople and two or three-quarters of data. The model also works better if your customers are relatively homogenous. If different salespeople are selling to distinct customer segments, it may not be accurate. For example, if you have one group of salespeople focuses on large businesses and another focuses on small to medium-sized businesses, specific metrics like average deal size may not be comparable between the two groups. In this case, I recommend running the model with the entire sales team combined, and then again with each distinct group separately to see how it impacts the results.
To use this model for your team, you will need the following data:
- Sales by rep per quarter for half a year, divided into two quarters.
- The total number of deals closed per rep per quarter.
The model analyzes each sales rep’s performance over a half-year using three sales data points: total revenue closed, the number of deals closed, and average deal size. It then calculates the mean (average), median (middle point), and standard deviation of each metric. Once you have the standard deviation, you can calculate a score (known as a z-score) for each value, which places the value within a standard normal curve. You probably remember (or vaguely remember) a standard normal curve. You can read volumes of information on the normal distribution, so I won’t go into dramatic detail here, suffice to say it looks like this:
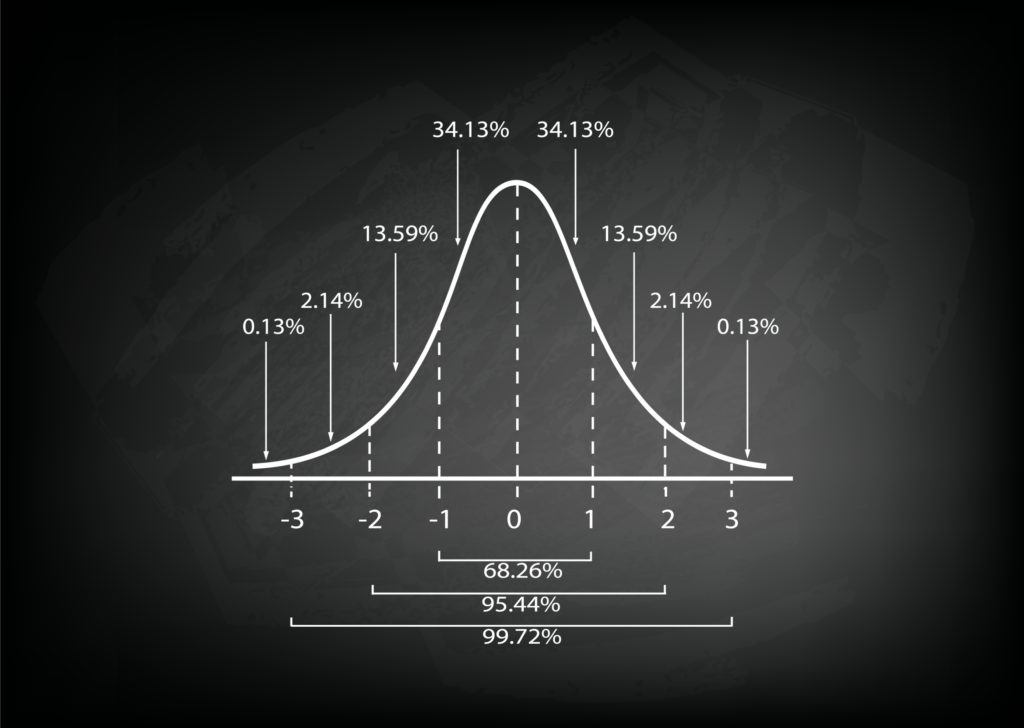
The beautiful part of a standard normal curve is that the model adjusts based on your specific team’s performance; you are computing the benchmarks based on your own team’s real-world data, not on a fabricated “wishful thinking” model. To calculate the z-score, you take each value, subtracting the mean, and then divide the result by the standard deviation. You will end up with a z-score value in the range of –3 and 3. So what is this score telling you? Anything between -1 and 1 means that the value falls within one standard deviation of your team’s average, which is roughly where ~68% of the values fall in a normal distribution fall. Anything within this threshold is within a reasonable margin of error and likely not a concern. Values that fall outside of this range should draw your attention. Let’s look at a hypothetical six-person sales team:
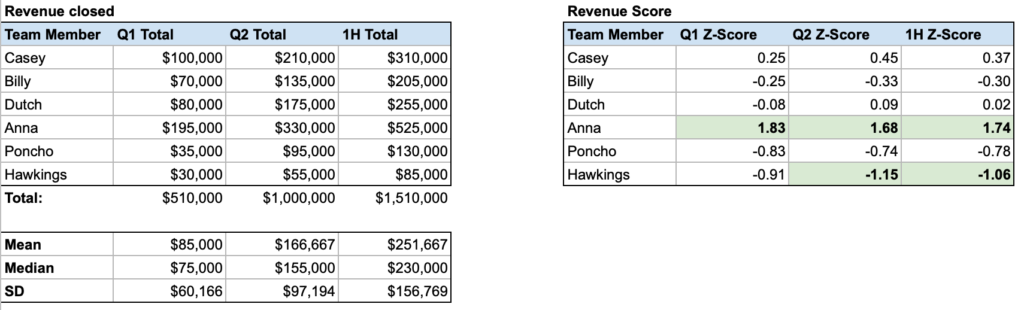
From the revenue score on the right, you can see the z-score for each of the six reps for Q1, Q2, and the 1st half of the year. I highlighted any values over outside of the -1 to 1 range in green. On this team, most of the reps are within the standard normal range, with two exceptions. Anna has consistently outperformed the other reps, and Hawkings is performing below the rest of the team. You might be thinking that you don’t need this model to see something so obvious. The purpose of the model is to remove your own bias and let the model calculate the following:
- The Mean/Median: what is an expected level of sales performance from a trained sales rep (let’s assume they are all fully trained).
- Z-Score (-1 to 1): where everyone ranks relative to the average level of performance: who needs additional training and coaching (closer to -1), and who are your top performers (closer to +1).
- Z-Score (outside of the 1st deviation): values outside of the -1 to 1 range deserve investigation. For example, are there individual reps that are vastly overperforming or underperforming the average on a particular metric.
Total revenue does not tell the whole story, so let’s look at the number of deals closed and average deal size per rep to get a clearer picture of the team’s performance:
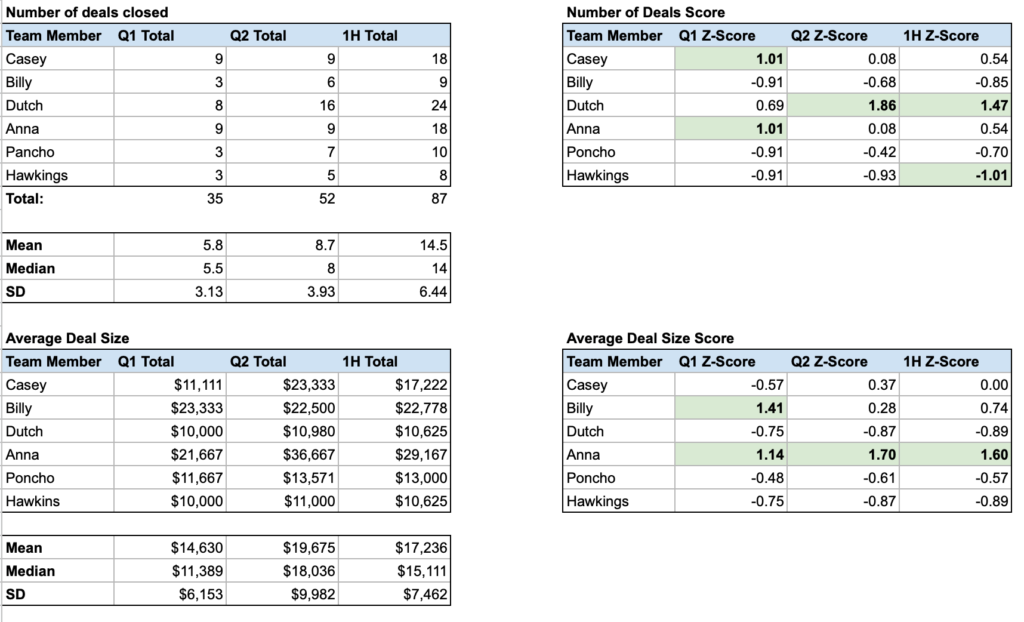
From the above data, you can see that Anna closes a similar amount of deals to the rest of the team, but her deals are a higher dollar value on average. Armed with this information, you can dig in deeper and find out if Anna is doing something different in her sales process that is leading to larger sales. Regardless of the cause, it is worth investigating metric outliers on your team to determine how to improve overall team effectiveness.
The point of this model is to provide a simple, mathematical way to evaluate a sales team’s performance. It is an excellent compromise for an early-stage company that is scaling fast and does not yet have the time or resources to build a more complex one. And frankly, I am not confident that more complicated models are an improvement. I hope this article stimulated your creativity and leads to improvements to your current or future sales team evaluation criteria!